Using the Map View
The Map View in Goliath lets you visualize properties geographically and target specific areas using polygon drawing. Instead of filtering by city or ZIP code alone, you can draw any shape—rectangle, polygon, or freeform boundary—directly on the map to zero in on neighborhoods, submarkets, or custom territories. Polygons combine with all other filters, so you can draw a neighborhood boundary and then layer on property-type, equity, or owner criteria to find exactly the deals you want. The map also provides overlays for Census Tracts, Flood Zones, and Opportunity Zones, plus tools to measure distance and search the visible area.
Step-by-Step Guide
Section titled “Step-by-Step Guide”-
Open the Map View
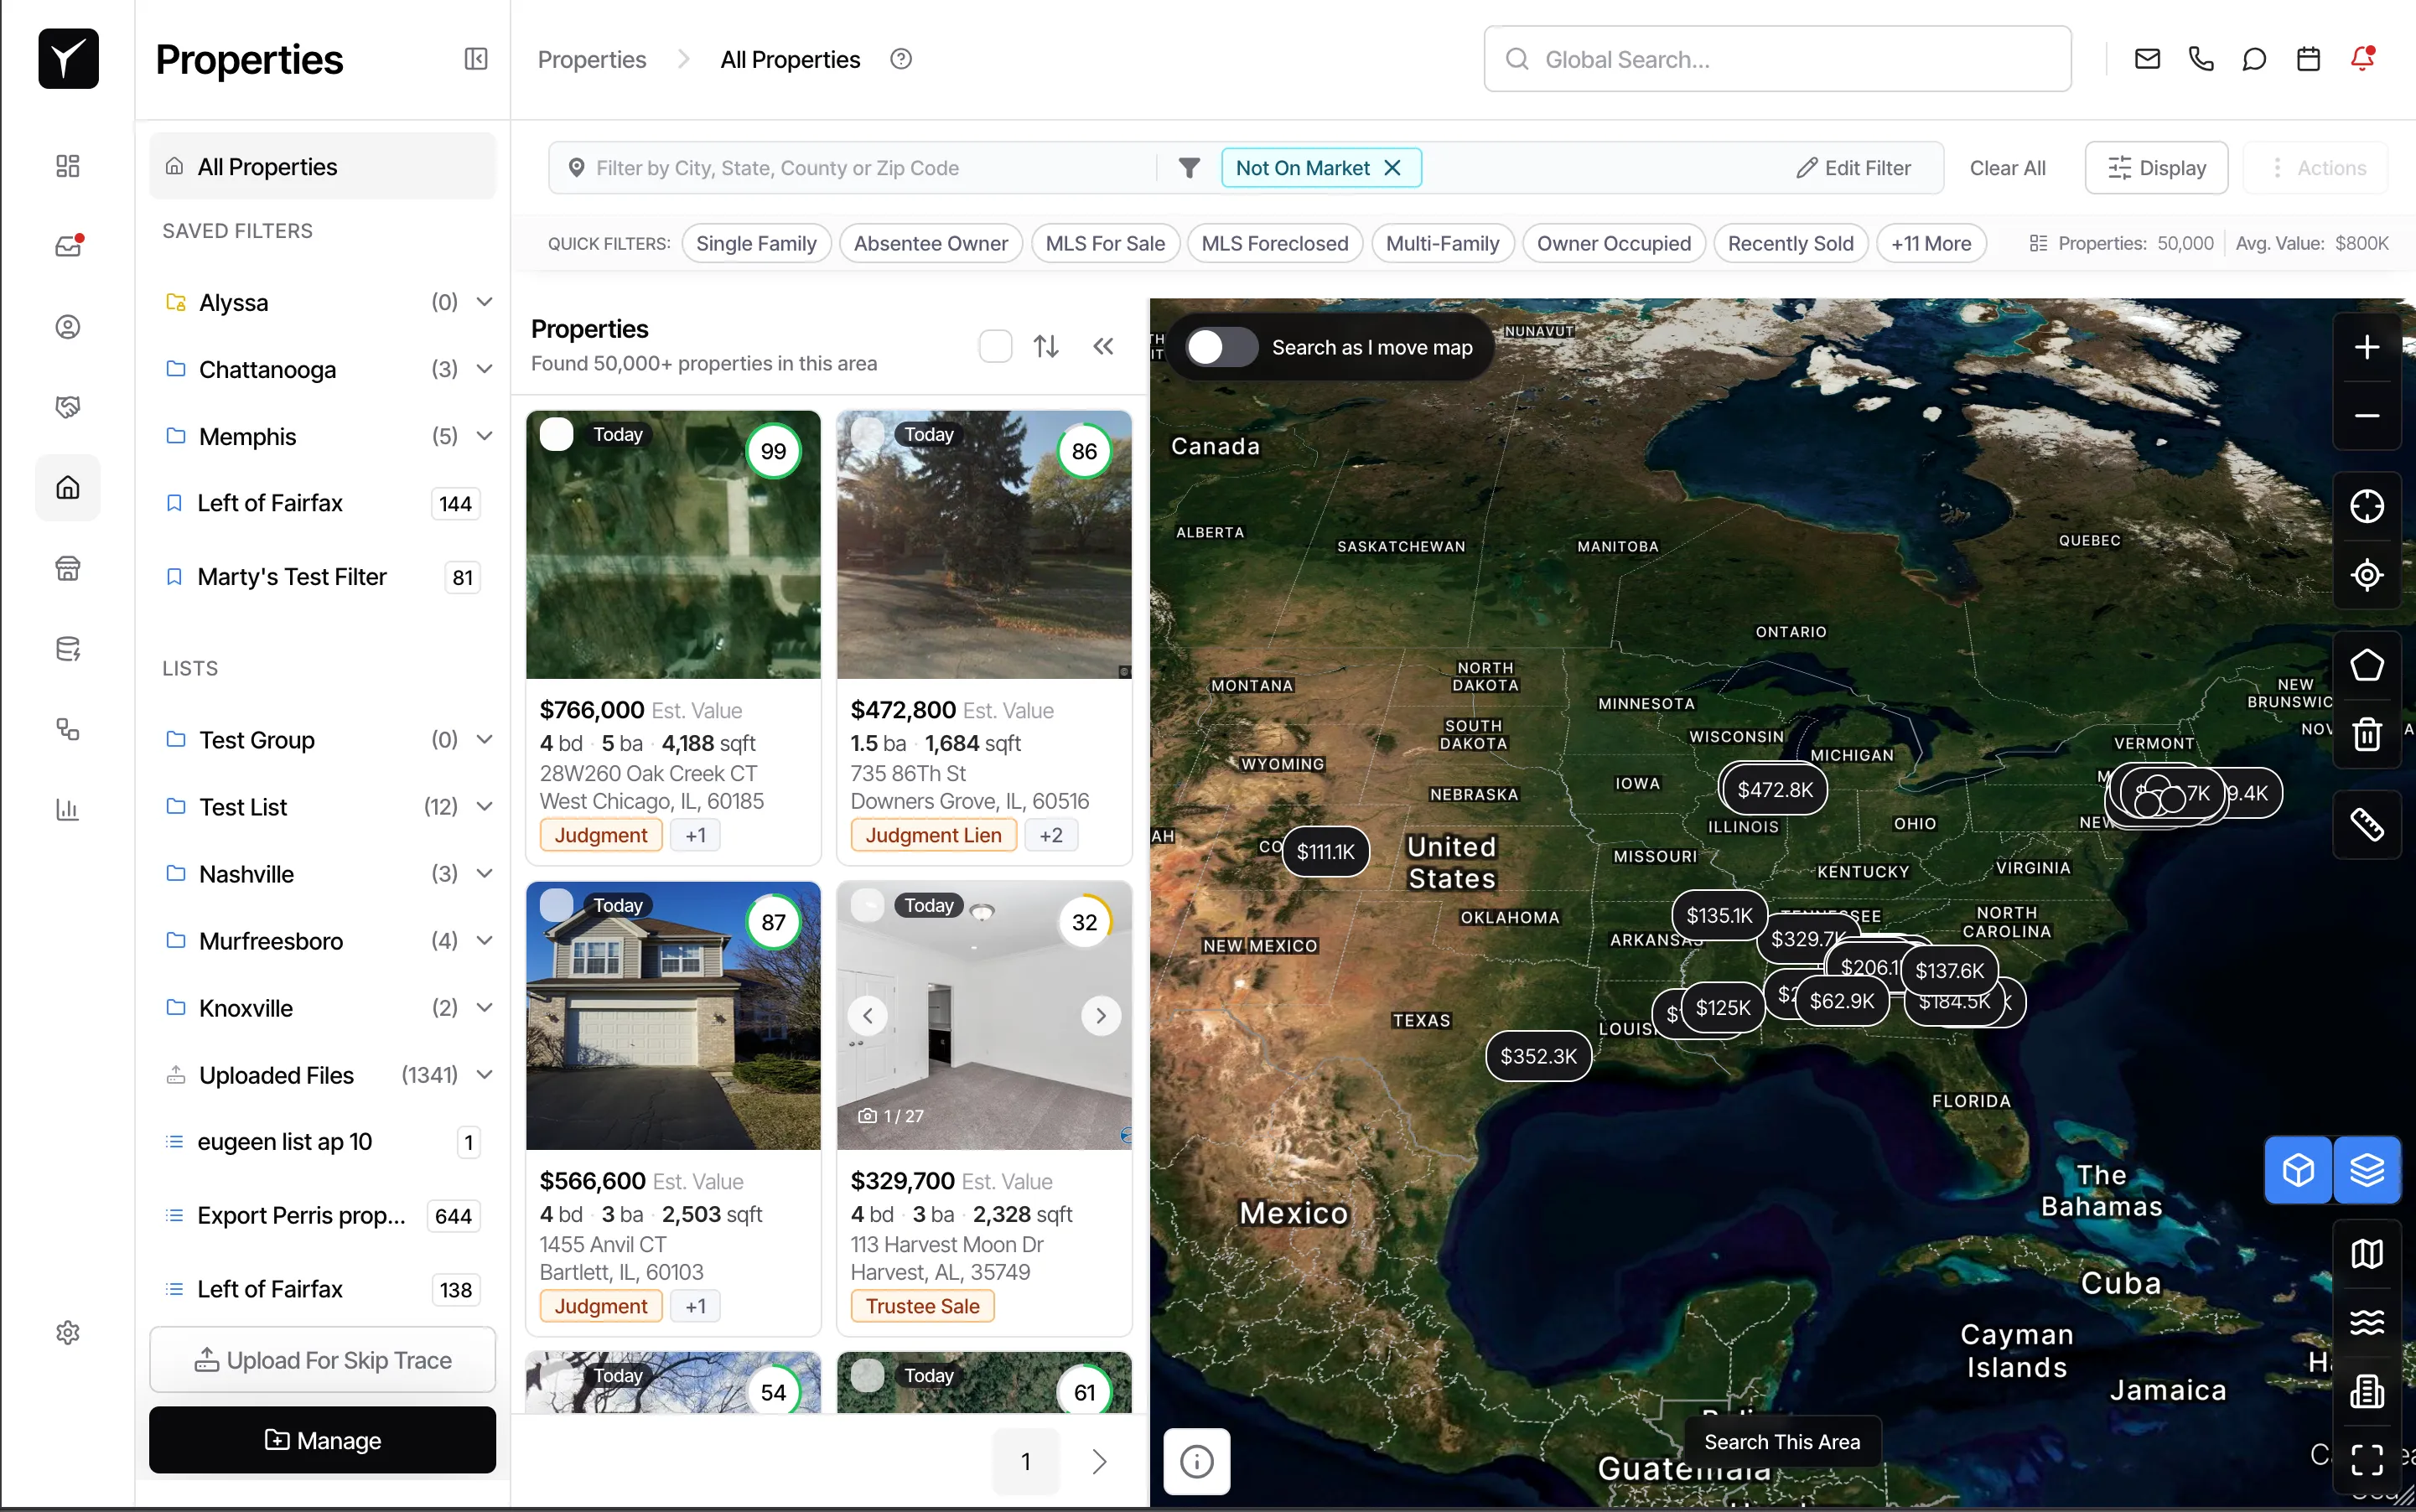
Navigate to the Properties module and click the Map tab or icon to switch from list view to the interactive map. The map displays all properties that match your current filters as individual pins or clusters, giving you an at-a-glance view of where opportunities are concentrated.
-
Zoom and pan to your target area
Use your mouse scroll wheel to zoom in (scroll up) and zoom out (scroll down). Click and drag the map to pan to the neighborhood or city you want to explore. You can also click the My location button to jump to your current GPS coordinates, or type an address into the search bar to center the map instantly.
-
Draw a polygon to define your search area
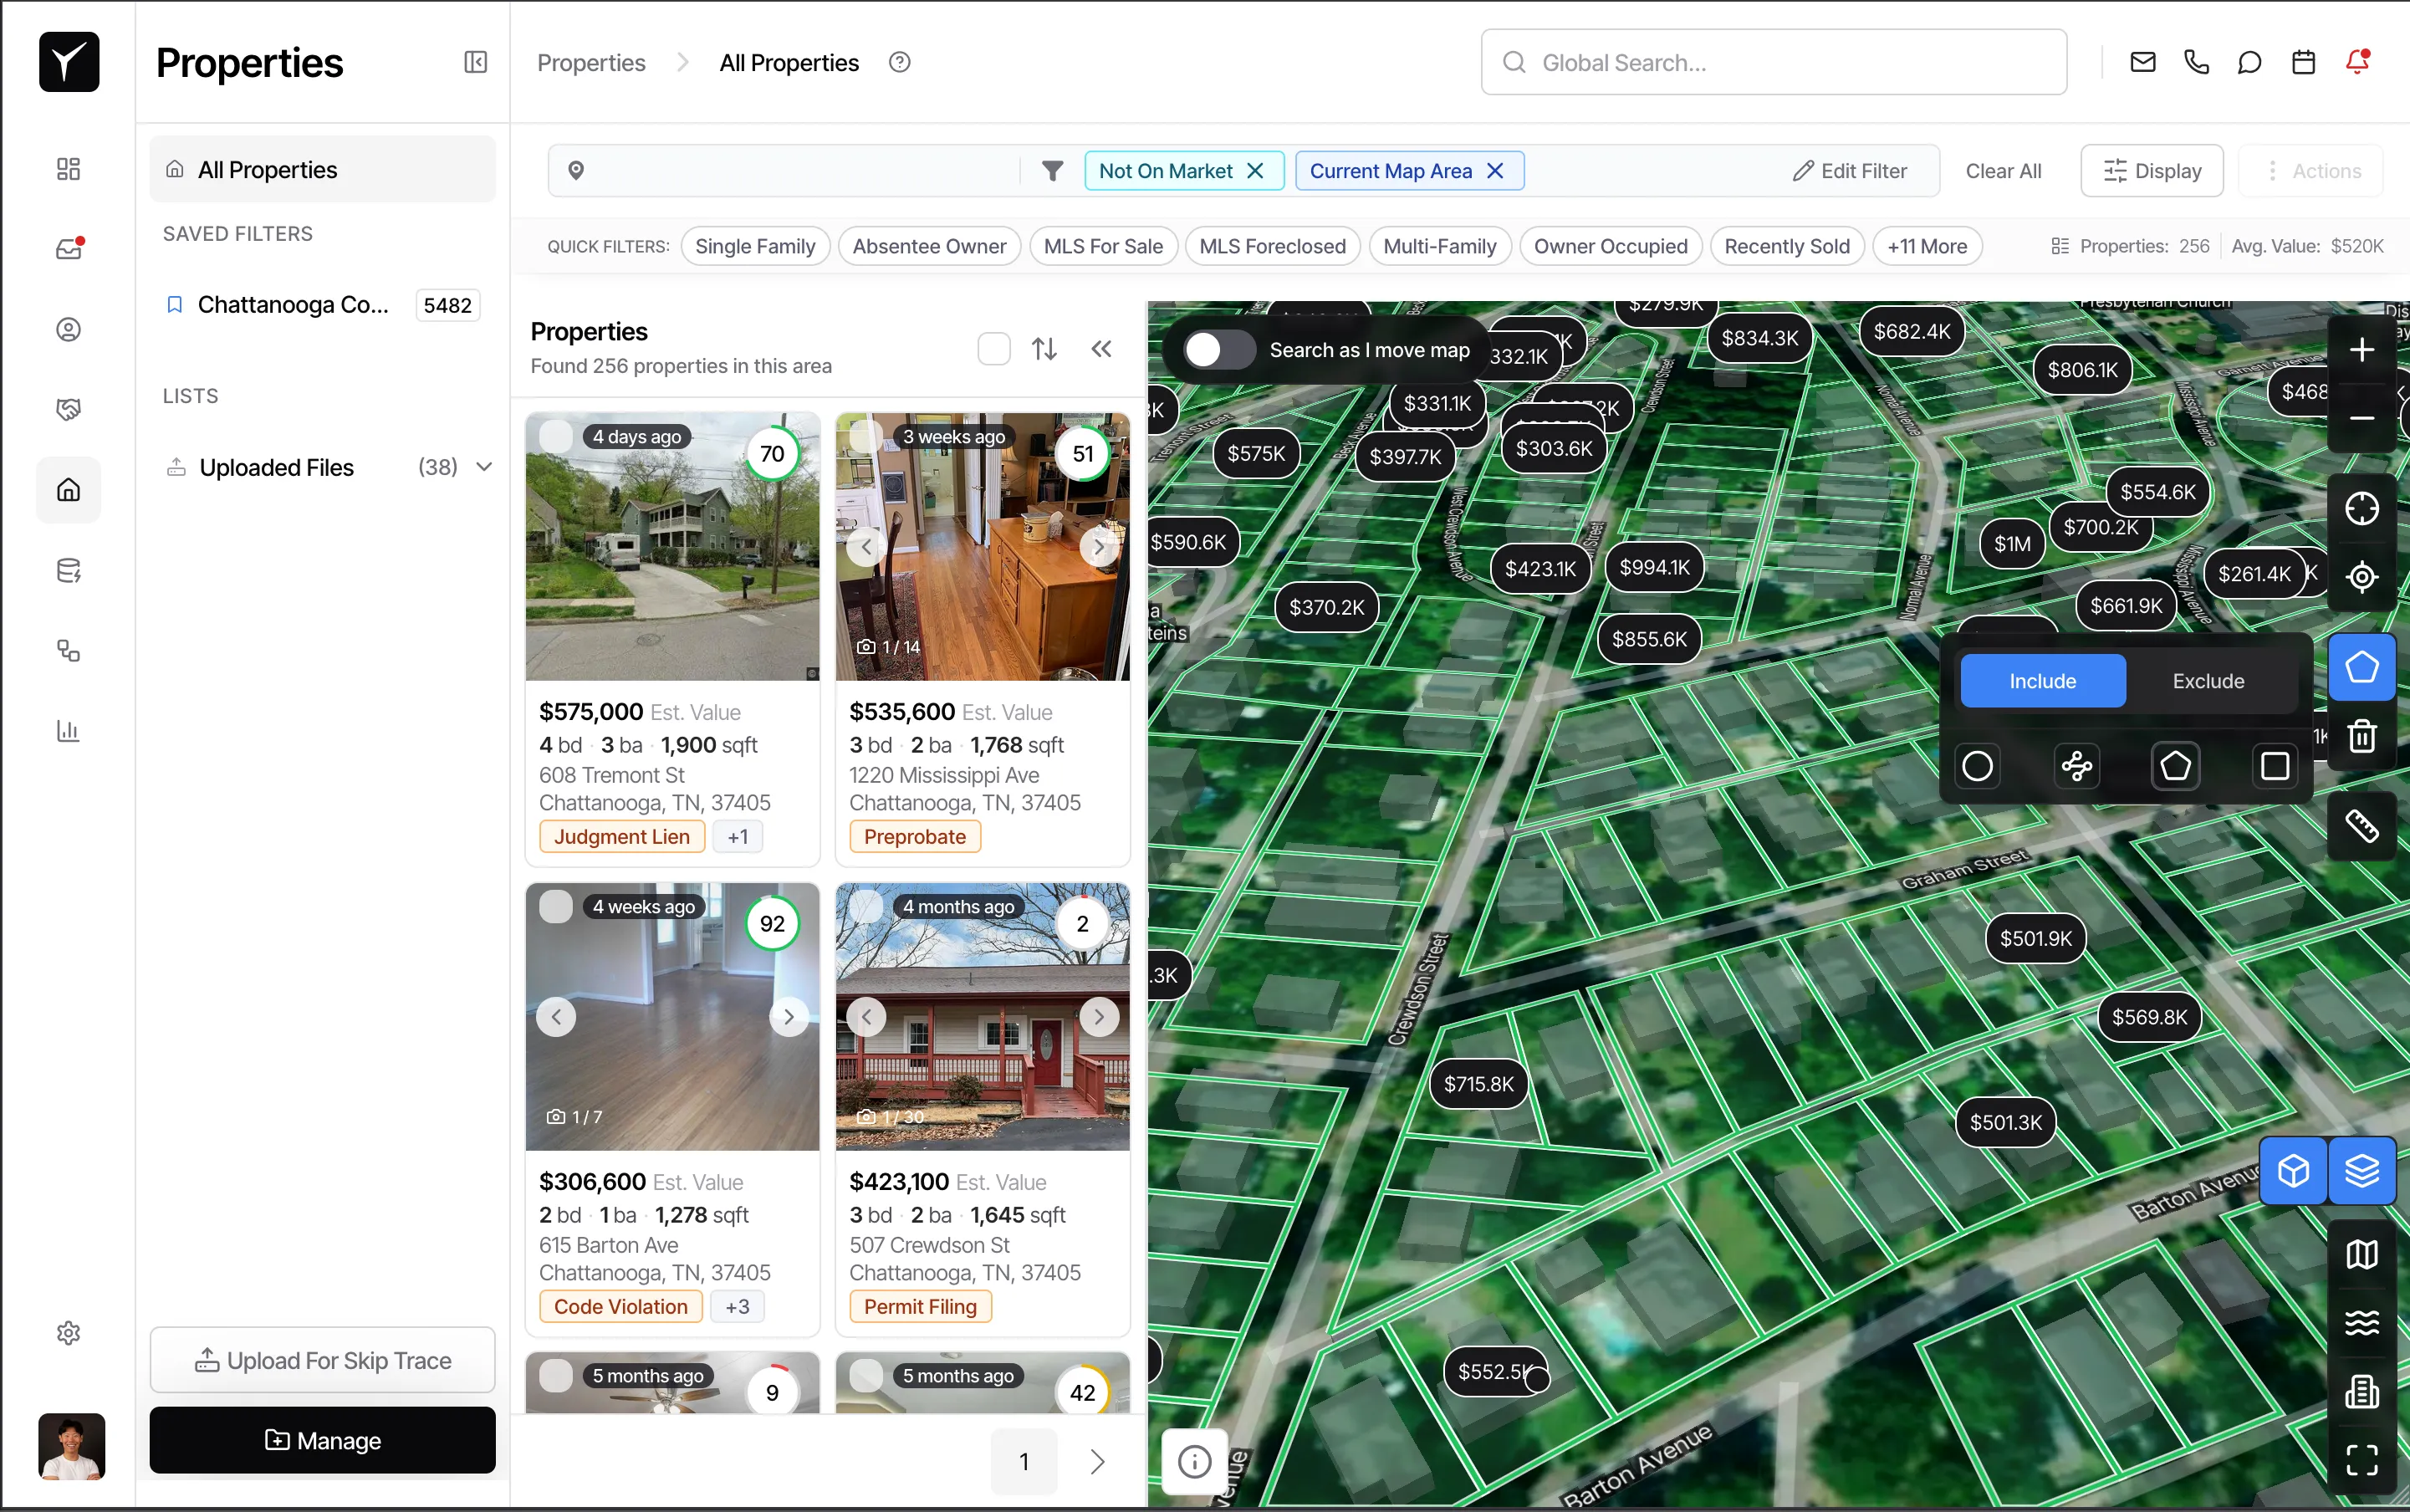
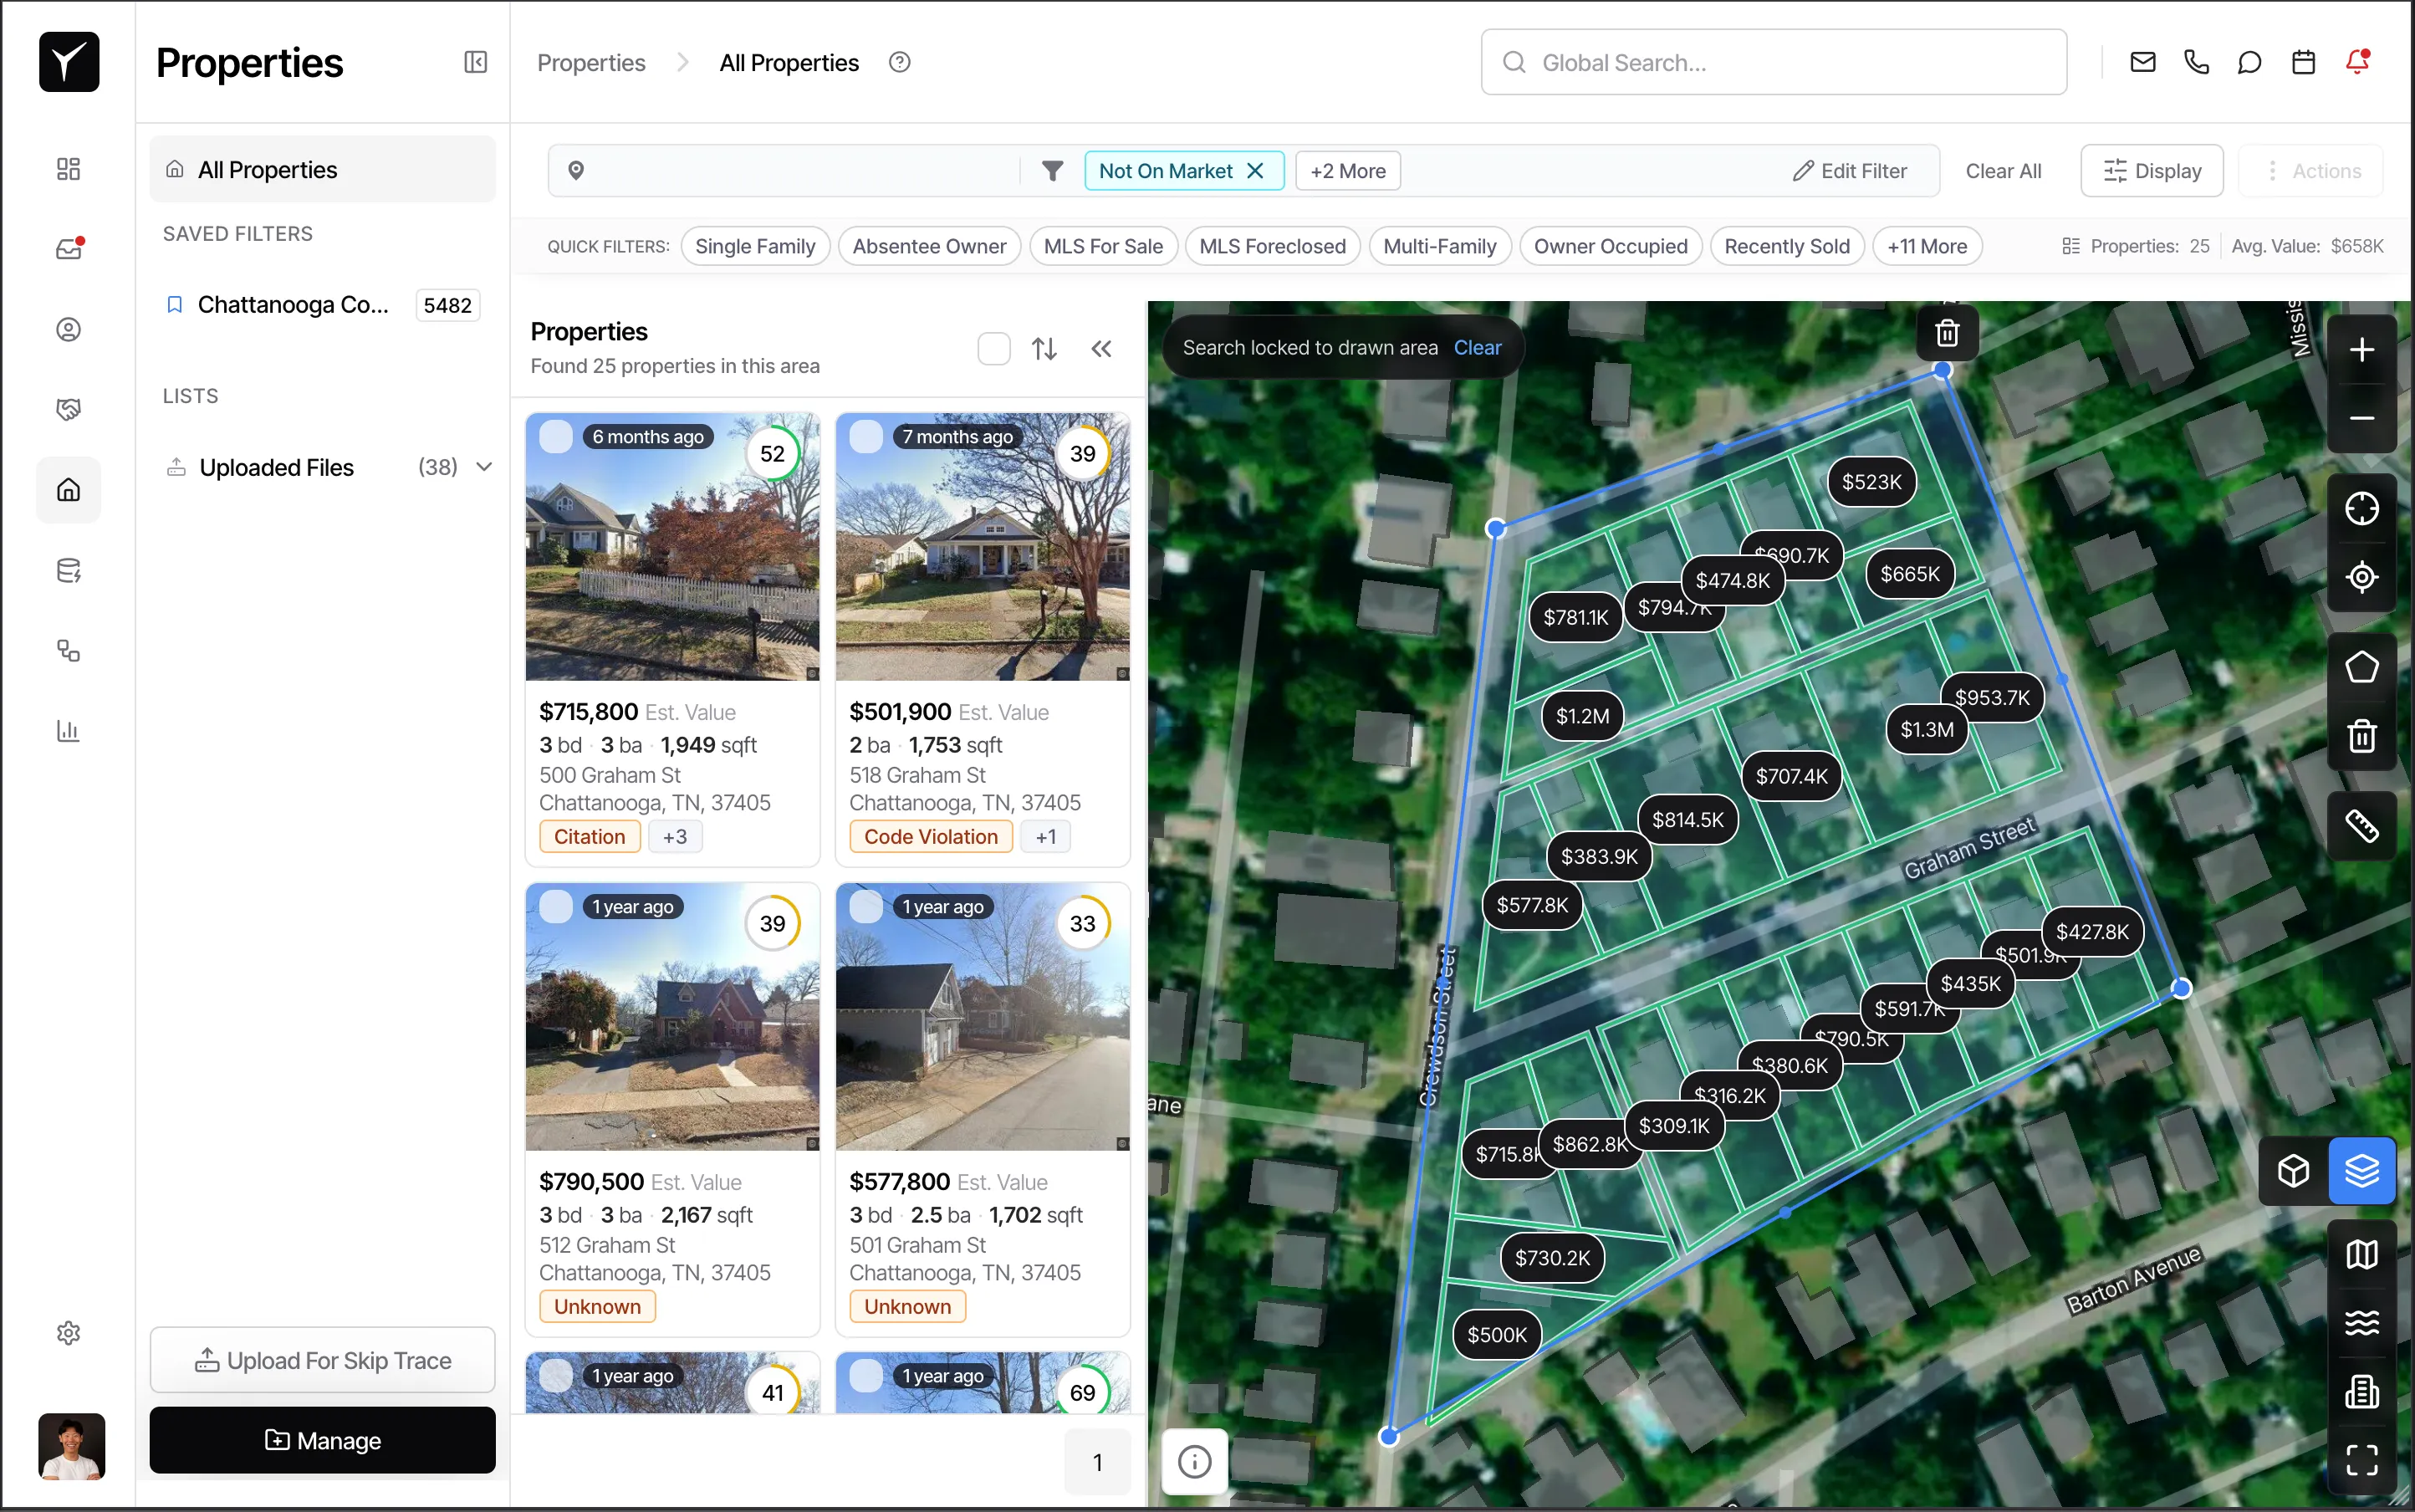
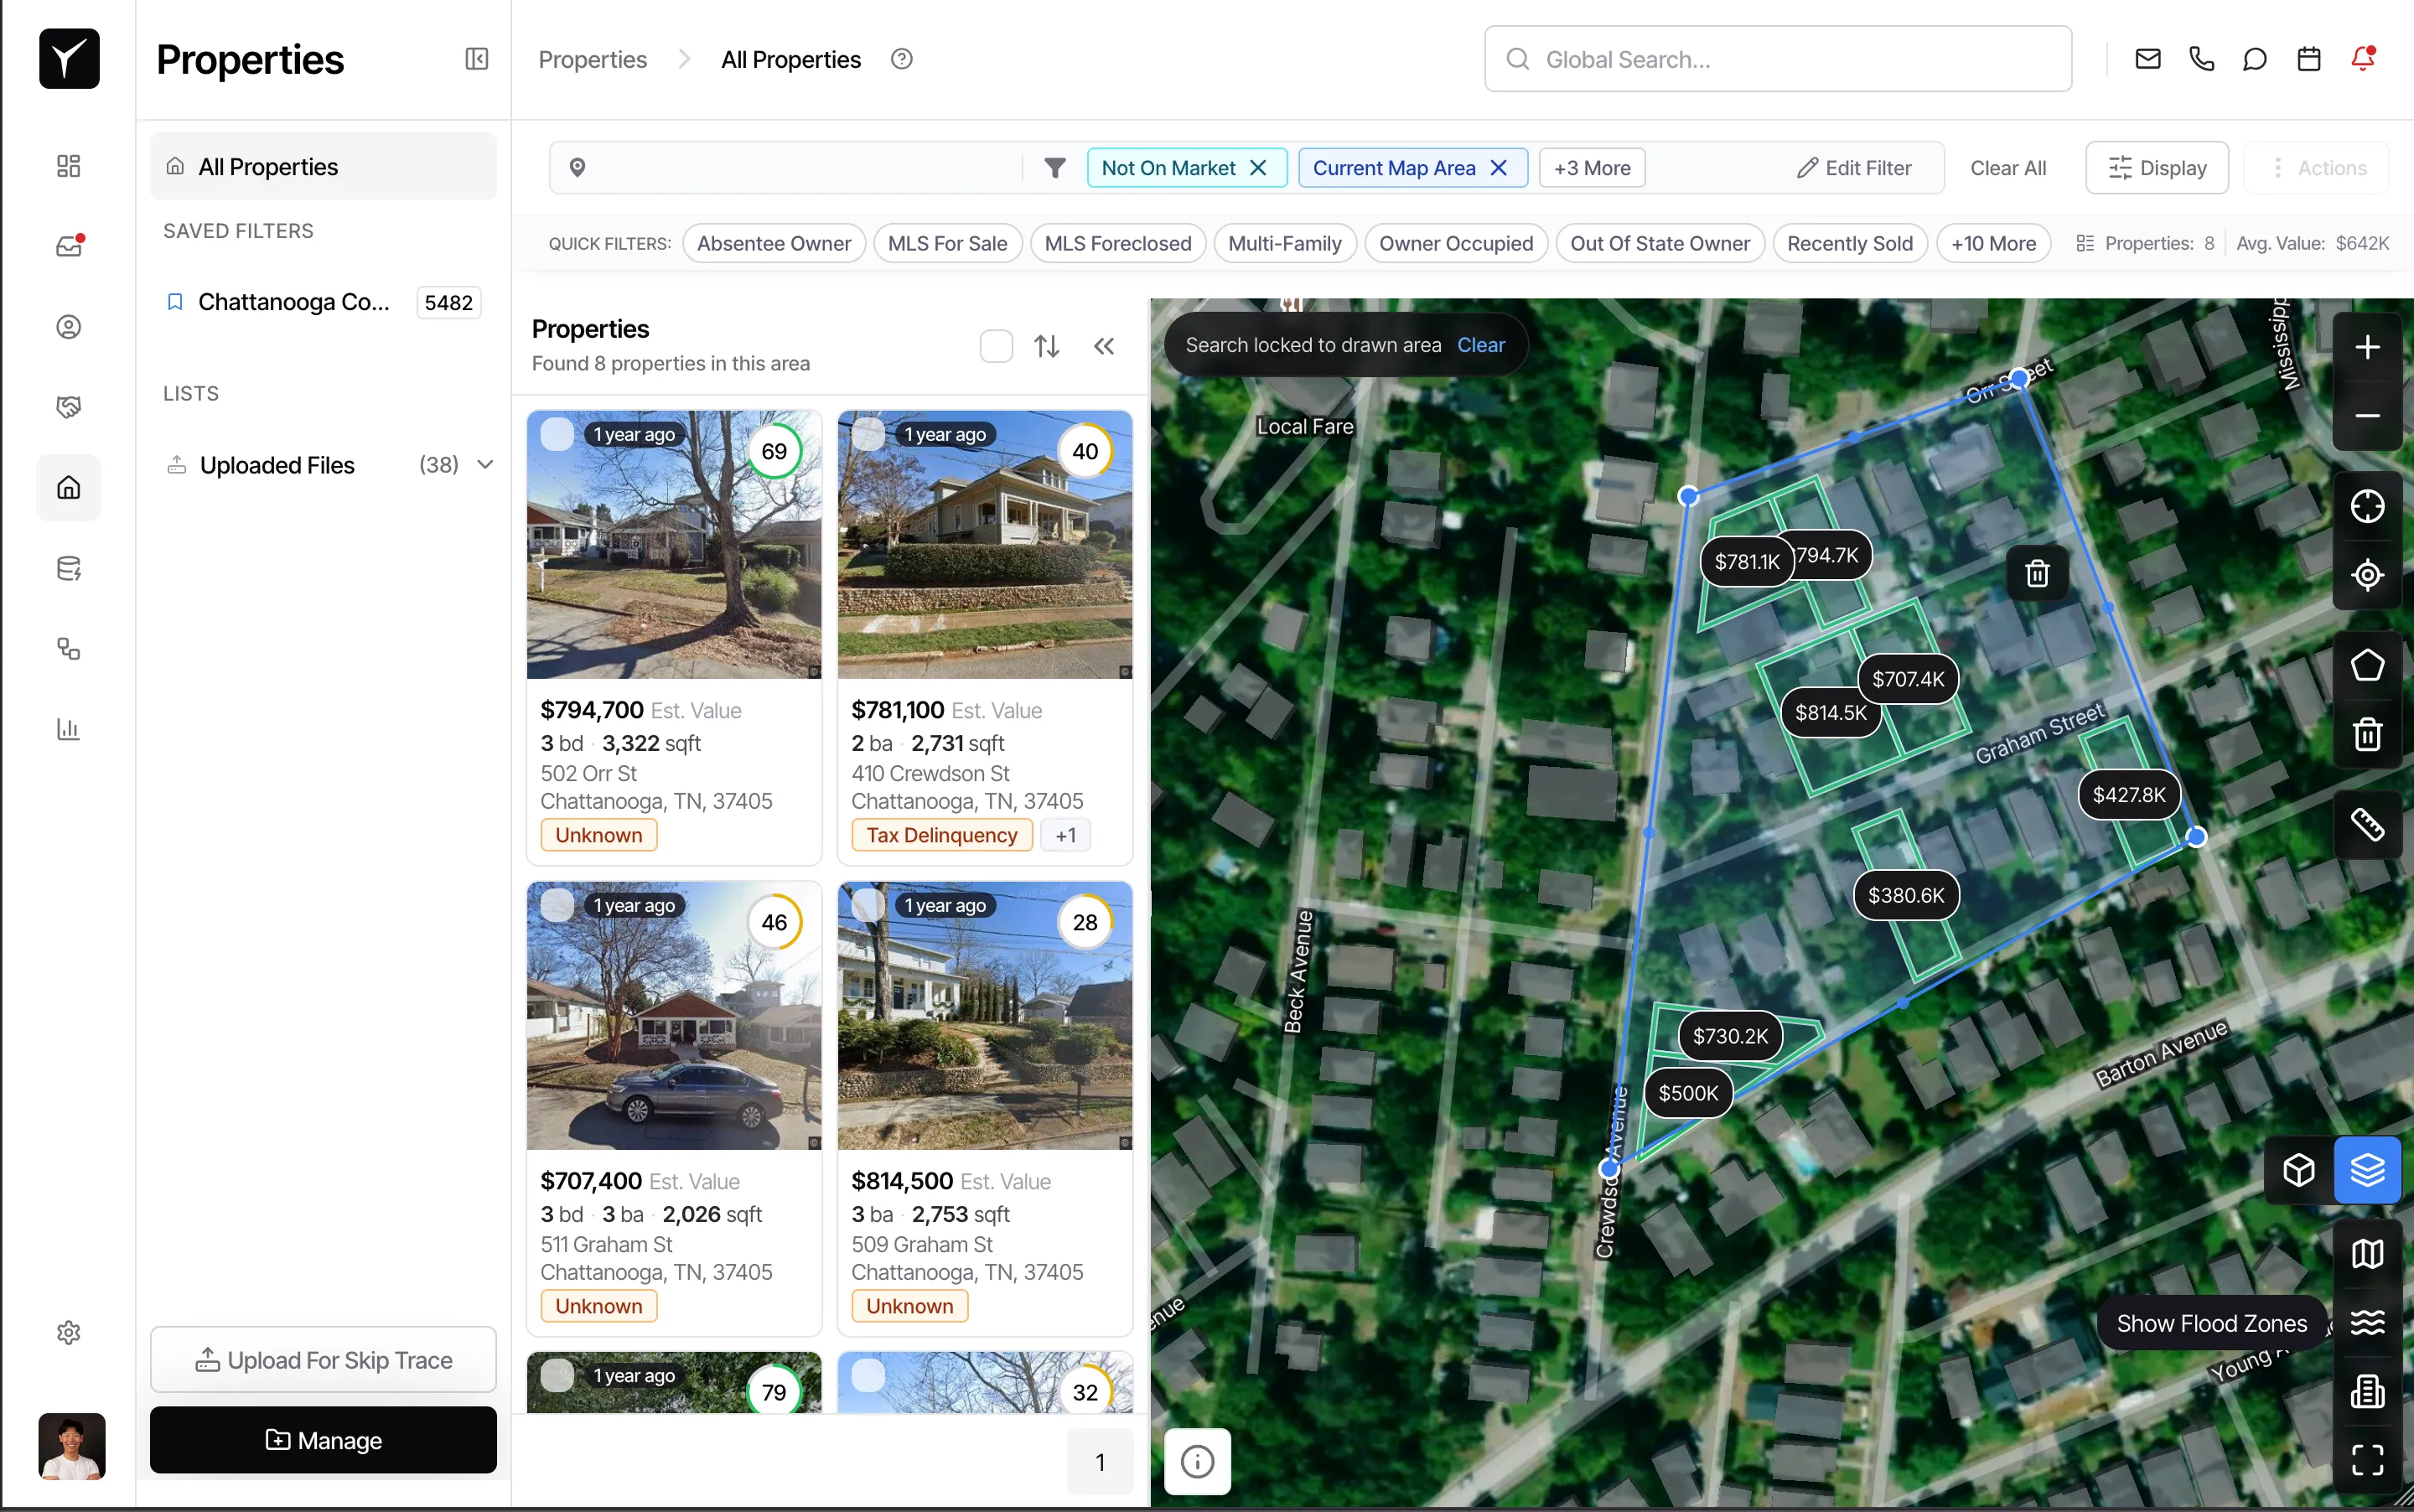
Click the Draw polygon tool in the map controls. Click once to start your shape, then click additional points to outline the area you want to target—draw a rectangle around a subdivision, trace a custom neighborhood boundary, or sketch a freeform shape along streets and landmarks. Double-click or click the starting point again to close the polygon. Goliath will immediately filter the property list to show only records inside your drawn shape.
-
Combine the polygon with other filters
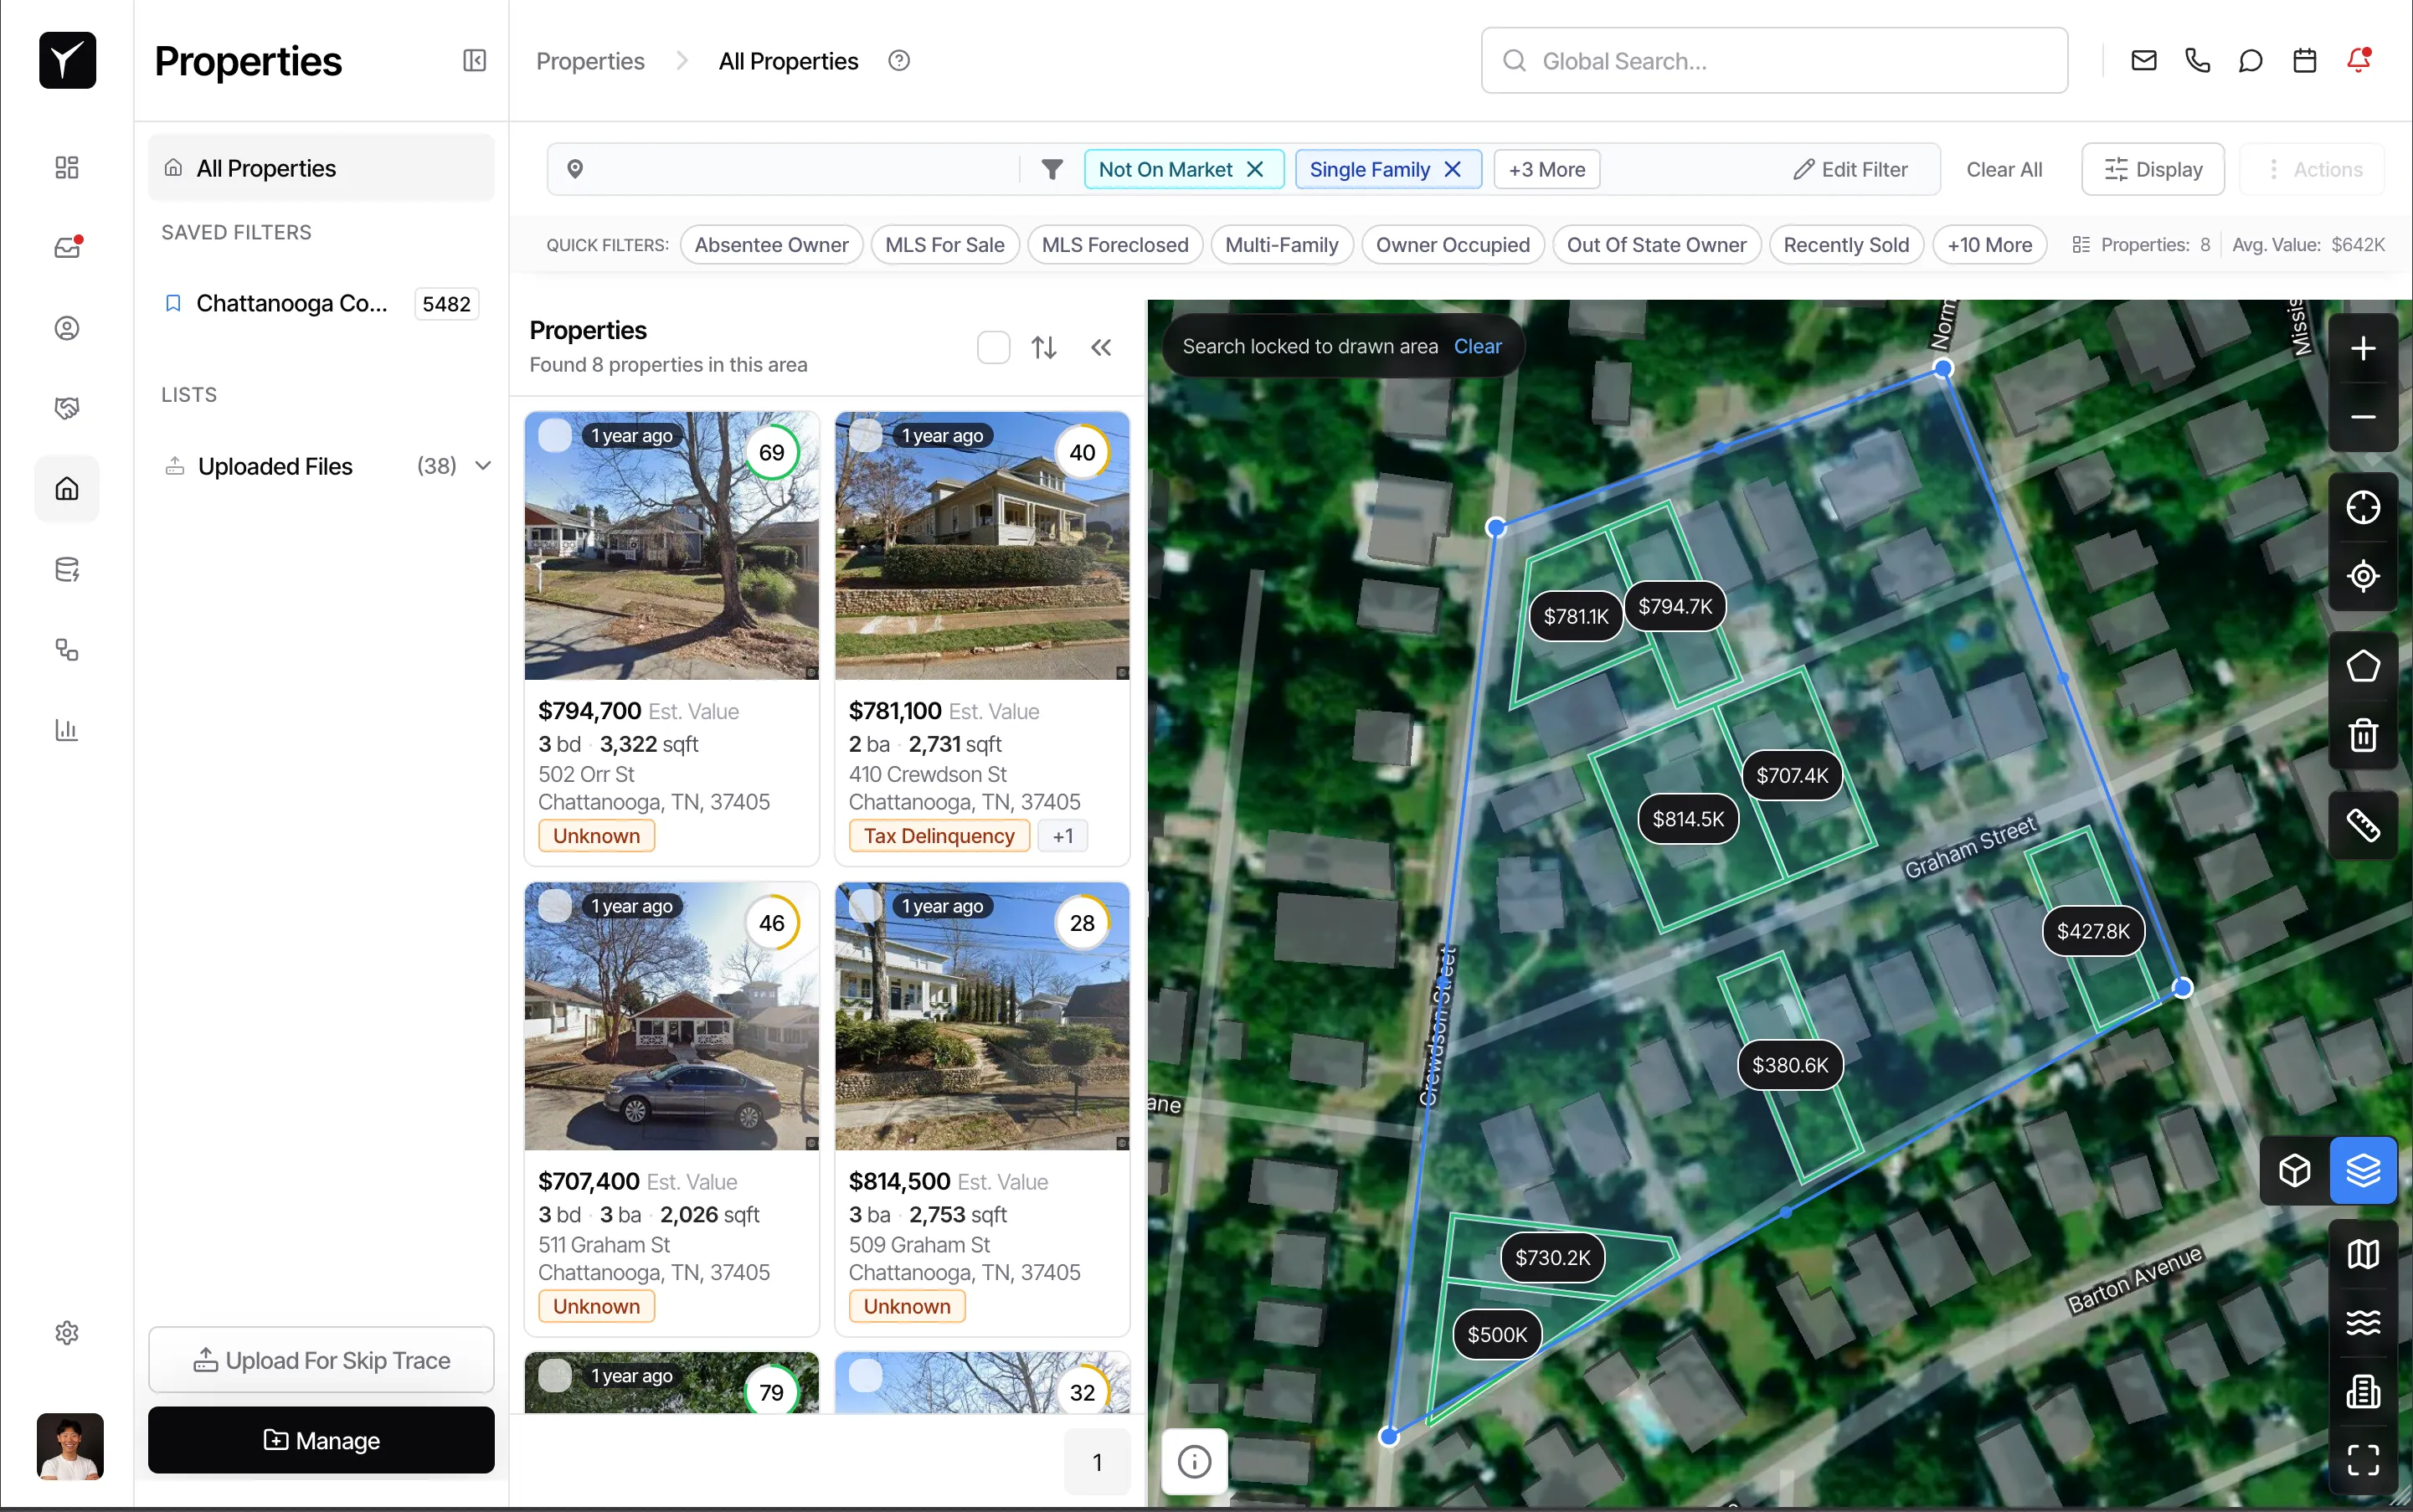
With your polygon active, open the filter panel and add property-type, equity, owner-occupancy, or any other criteria. For example, draw a polygon around a gentrifying neighborhood, then apply a Single Family + High Equity filter to surface targeted acquisition candidates in that specific area. The map and list update in real time to reflect the combined filters.
-
Refine your search with map tools
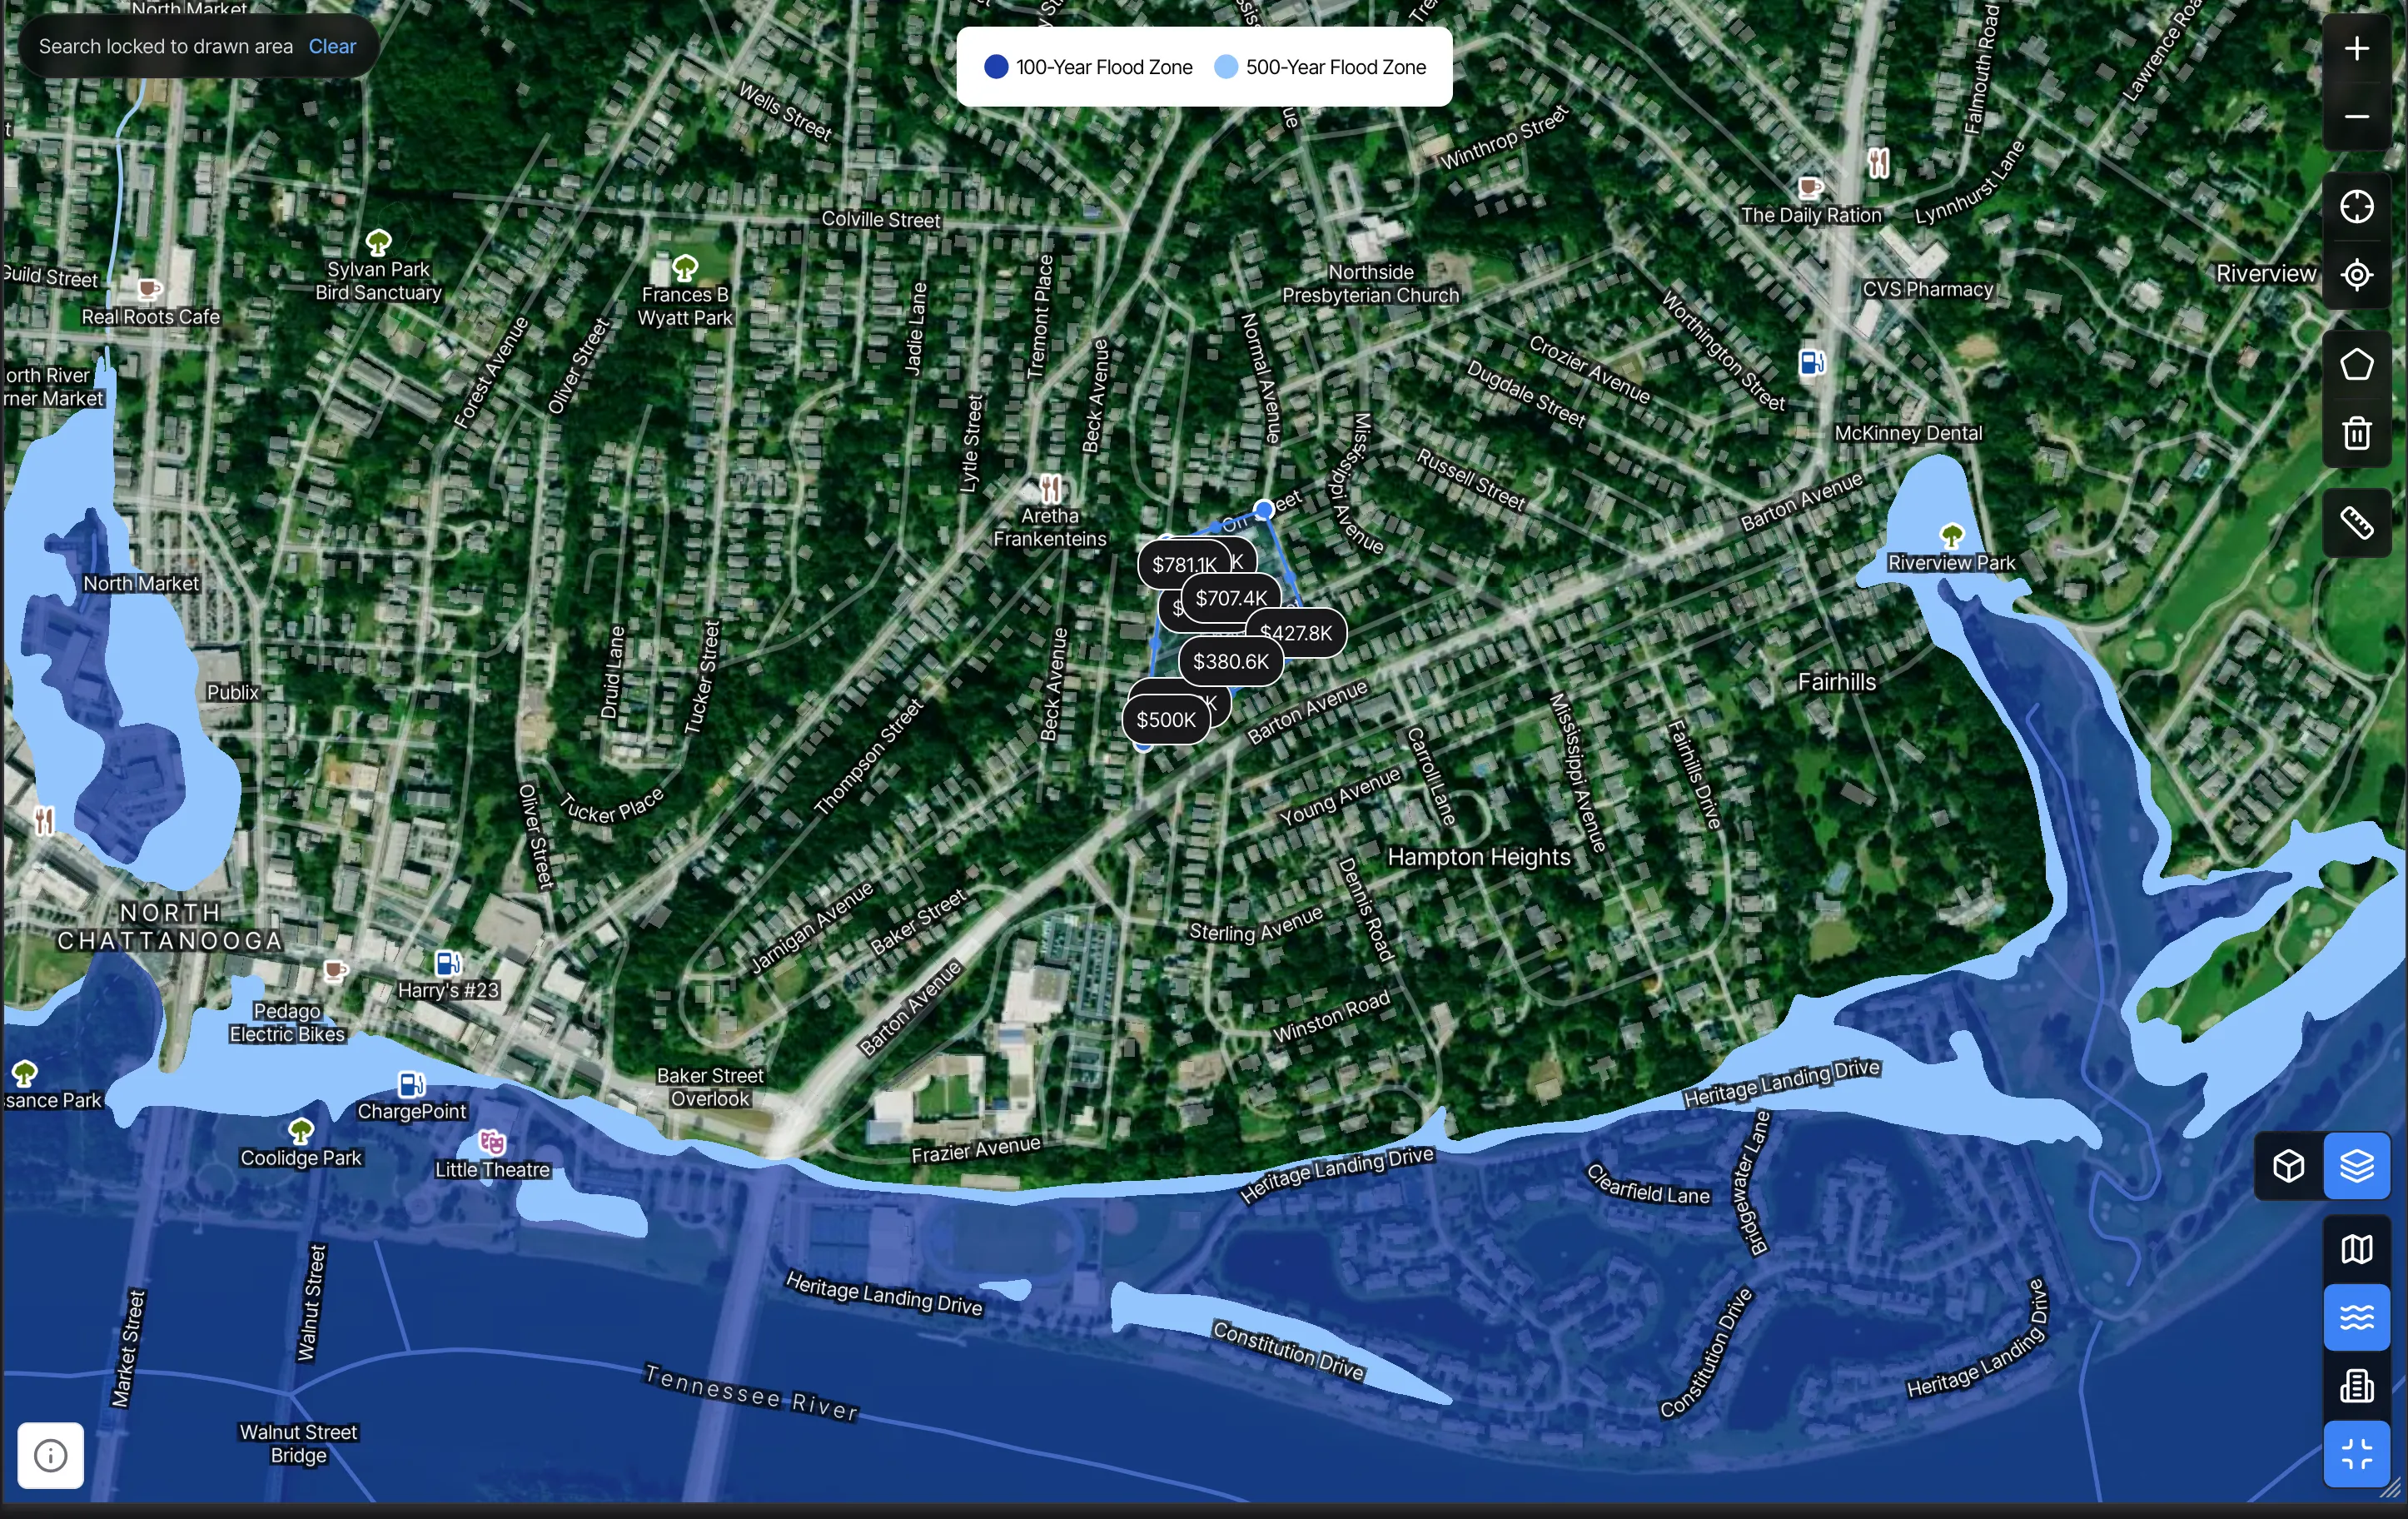
Use Search this area to refilter properties based on the current viewport—helpful when you’ve panned to a new location without drawing a polygon. Toggle overlays for Census Tracts, Flood Zones, or Opportunity Zones to layer in demographic and regulatory context. Click Measure distance to calculate distances between properties or from a property to a landmark. Switch between 2D and Street View to see properties at ground level.
-
Clear or edit your polygon
To remove your polygon and return to the full dataset (or the previous filter set), click Delete polygon in the map controls. You can then draw a new polygon or rely on text-based filters alone. Polygons are session-based, so refresh the page or navigate away to reset.
Frequently Asked Questions
Section titled “Frequently Asked Questions”Q: Do polygons replace my other filters, or combine with them?
Section titled “Q: Do polygons replace my other filters, or combine with them?”Polygons combine with all other filters. Draw a shape to define geography, then add property-type, owner, equity, or any other criteria to narrow further.
Q: Can I save a polygon to reuse later?
Section titled “Q: Can I save a polygon to reuse later?”Polygons are session-based and clear when you refresh the page. To reuse a geographic search, consider saving a Saved Search with the polygon active, or use city and ZIP filters for recurring areas.
Q: What’s the difference between “Search this area” and drawing a polygon?
Section titled “Q: What’s the difference between “Search this area” and drawing a polygon?”Search this area filters to the current map viewport (whatever’s visible on screen), while a polygon lets you draw a precise custom boundary that persists as you zoom and pan.
Q: How do I zoom the map quickly?
Section titled “Q: How do I zoom the map quickly?”Use your mouse scroll wheel—scroll up to zoom in, scroll down to zoom out. This is faster and more intuitive than clicking the zoom buttons.
Q: Can I measure the distance between two properties?
Section titled “Q: Can I measure the distance between two properties?”Yes. Click Measure distance in the map controls, then click two points on the map to see the distance in miles or feet. This is useful for evaluating clustering or proximity to landmarks.